|
|
|
|||
|
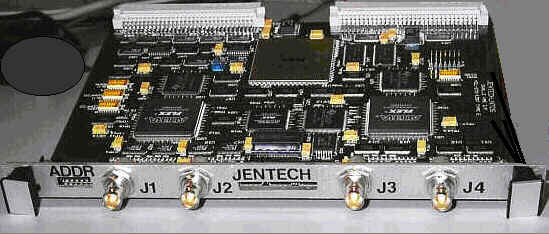
The board also provides a user program trace feature. The trace feature is invoked and terminated by software instruction. When invoked, a program trace file is generated which contains a sequential list of user instructions as executed by the board. The user can elect to timestamp the entries in this trace file, providing detailed timing information regarding program execution. This file is stored in a circular queue located in on-board RAM. The user can retrieve this trace file to recover detailed information regarding the sequence of instruction execution performed by the board. In addition, the Dual E board is equipped with two JTAG ports which are used at the factory to download board level diagnostic and fault isolation software. This greatly reduces the time required to perform maintenance and make any needed repairs. Future uses of these JTAG ports could include some type of expanded on-site fault isolation, NTDS signal injection and passive tap monitoring. Currently a self-test loopback capability exists for each NTDS interface which can be invoked via software instruction. This allows users to verify system level operation of the board and to isolate VME from NTDS. |
